You Can’t Tailor the Cell. So Where Does Value Actually Come From in BESS?
How pack-level design, battery degradation, and operational strategy shape battery energy storage system economics.
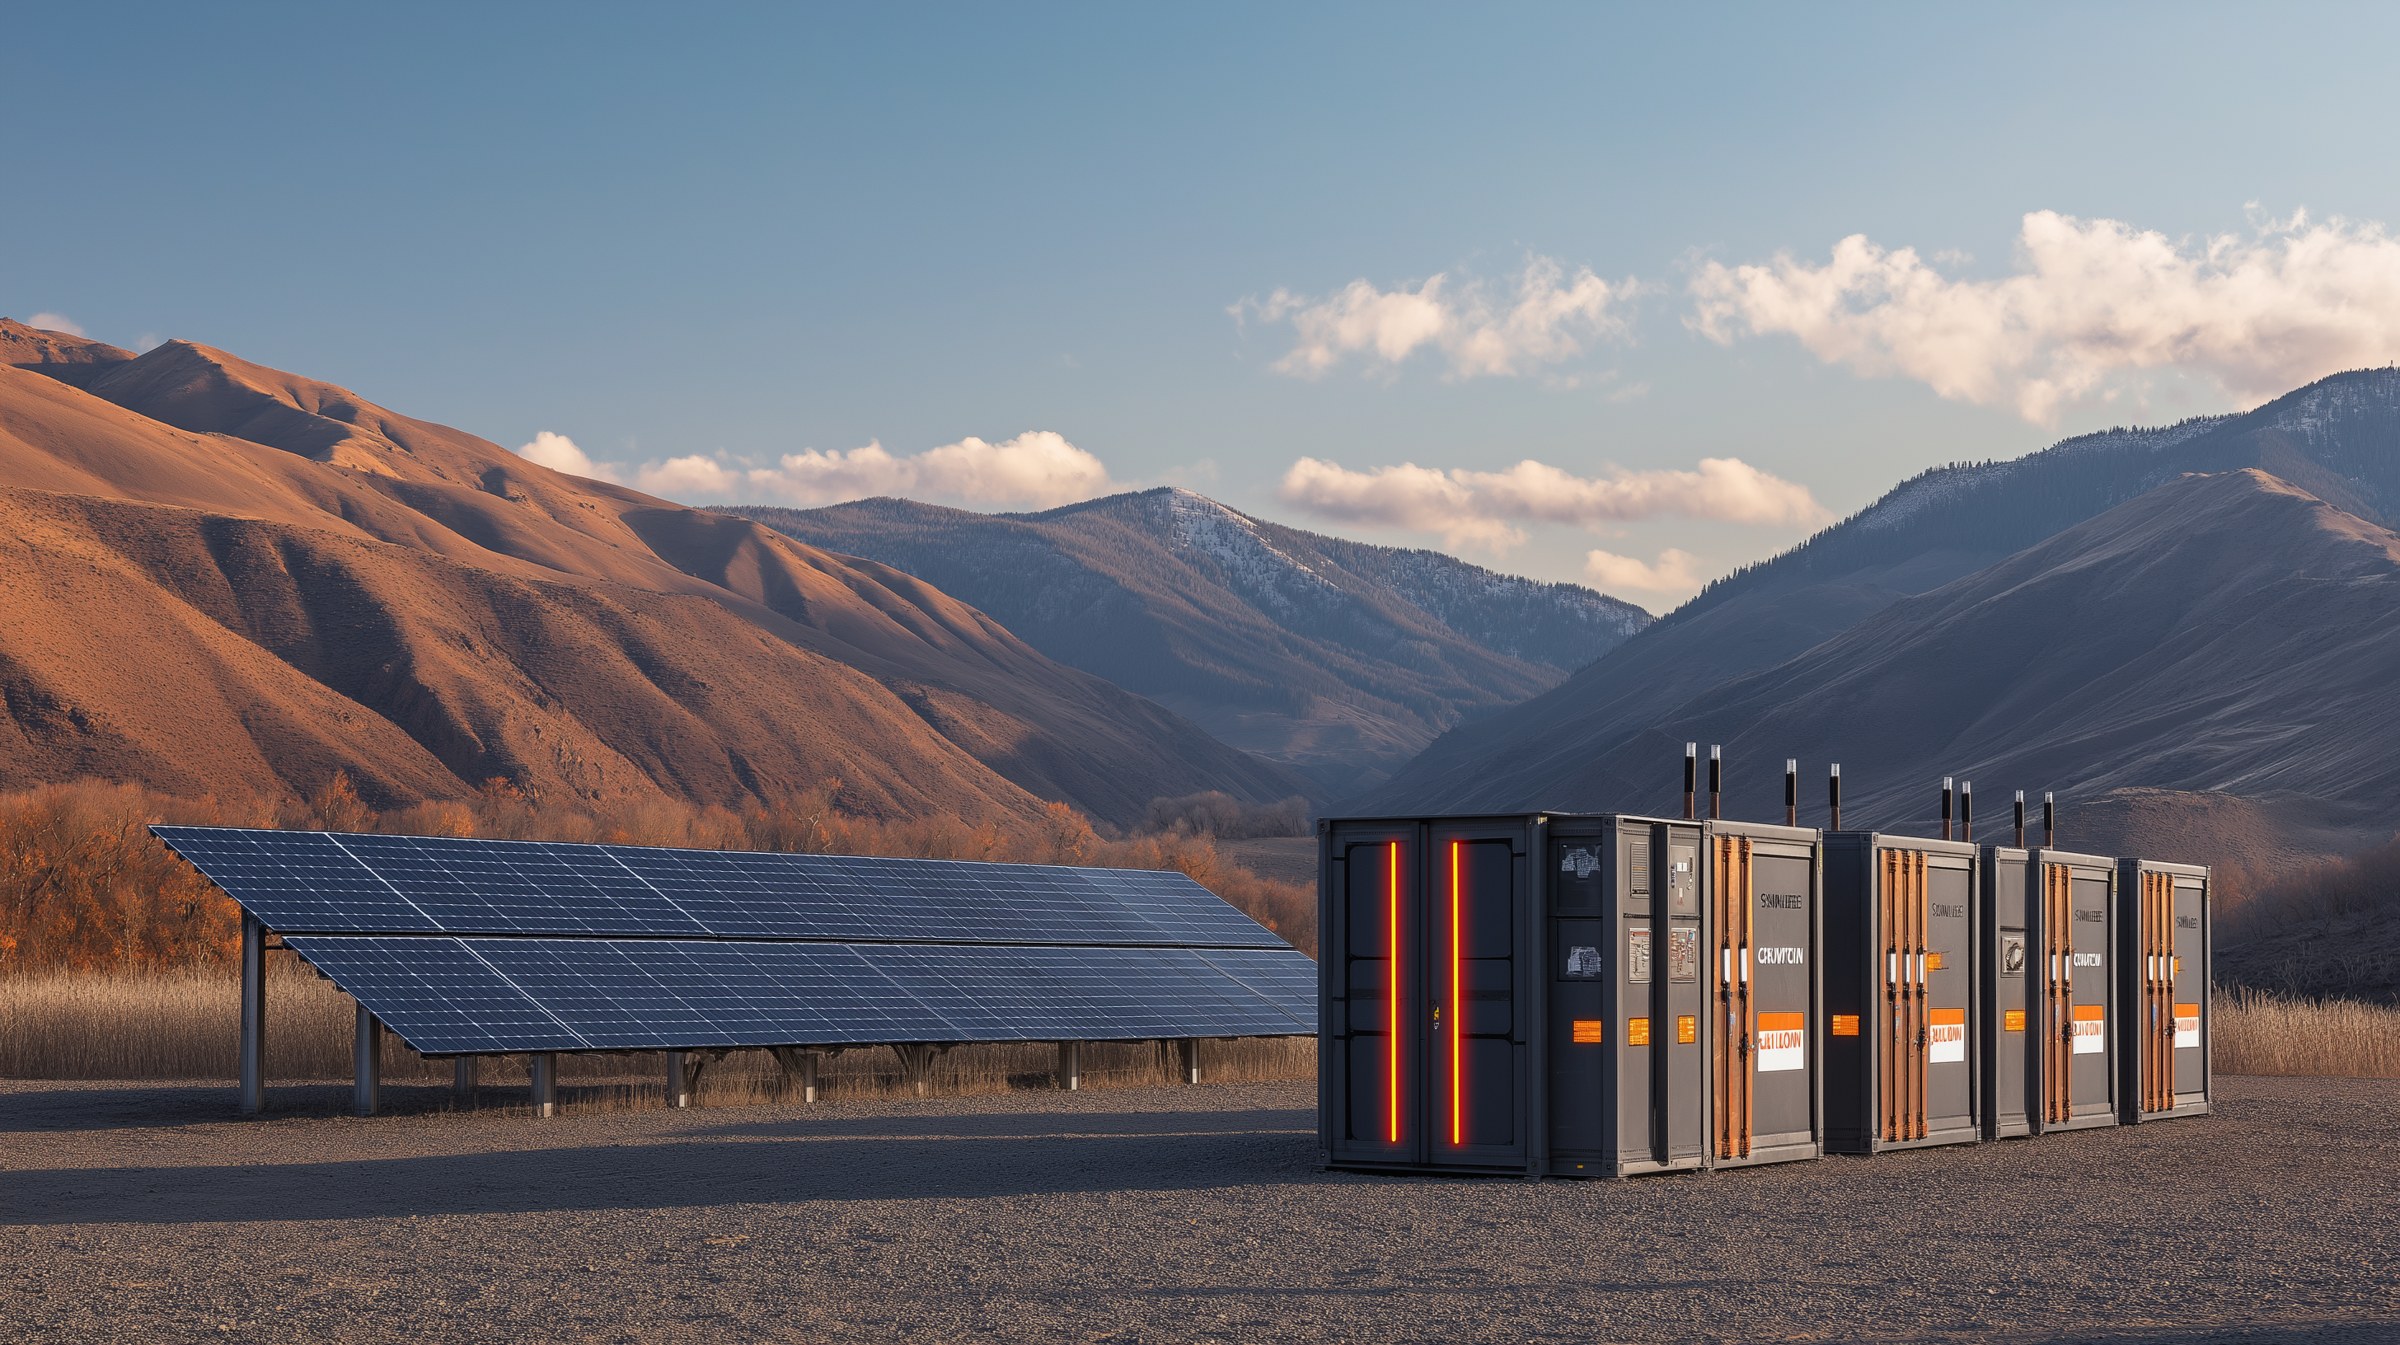

The Cell Is a Constraint in Modern BESS Projects
In most real-world BESS projects today, the cell is not a design variable.
It is a constraint.
Cell supply chains are global. Chemistries are standardized. Form factors are fixed. Delivery timelines are non-negotiable.
For most Indian grid and C&I projects, you are selecting from commercially available LFP or NMC cells, not designing a custom electrochemical system. This changes the engineering problem fundamentally.
The question is no longer:
“What is the optimal cell chemistry?”
It becomes:
“Given the cell I can actually procure, how do I maximise lifetime energy, minimise degradation, and optimise project IRR?”
When the cell is fixed, value creation shifts upward to the pack and system level.
Where Value Used to Come From in Battery Systems
Historically, differentiation in battery systems came from:
- Energy density
- Chemistry innovation
- Cell-level breakthroughs
- Cost curve improvements
But in today’s BESS market:
- Energy density is rarely the limiting factor.
- Most projects are volume-constrained, not gravimetric-constrained.
- Cell prices are converging globally.
- Chemistries are commoditizing.
Which means:
The pack is now the product and the most powerful lever at pack level is degradation control.
The Pack-Level Levers That Determine BESS Economics
Once the cell is fixed, five pack-level levers determine lifetime value:
- Depth of Discharge (DoD) strategy
- Thermal architecture
- C-rate shaping and dispatch strategy
- Initial oversizing vs replacement timing
Each of these directly changes degradation trajectory. Let’s examine them technically.
Depth of Discharge Is Not an Operational Detail. It’s an Economic Lever.
Cycle life is strongly dependent on DoD.
Representative LFP Behaviour
| Depth of Discharge | Cycle Life (EFC) |
|---|---|
| 20% | ~8000 cycles |
| 40% | ~5000 cycles |
| 60% | ~3500 cycles |
| 80% | ~2200 cycles |
| 100% | ~1500 cycles |
Moving from 80% DoD to 60% DoD can increase cycle life by ~60%. Now convert that to economics.
Example: 20 MWh BESS, 1.2 cycles/day
- At 80% DoD → ~2200 cycles → ~5 years to 70% SoH
- At 60% DoD → ~3500 cycles → ~8 years
That is a 3-year difference in replacement timing.
At ₹9-11 crore/MWh installed cost (typical India utility-scale range), early replacement is a catastrophic CAPEX event.
DoD strategy is not just operational, it is capital structuring.
Temperature Is a Silent Multiplier
Battery degradation follows Arrhenius behaviour.
A simplified representation:
Relative ageing rate roughly doubles for every 8–10°C increase.
In Indian conditions:
- Ambient temperatures of 35-45°C are common.
- Container-level hotspots are frequently higher.
- Poor airflow or thermal imbalance accelerates localized ageing.
A pack operating at sustained 40°C ages ~2× faster than at 28°C. If your financial model assumes uniform degradation independent of temperature, you are underpricing risk.
Dispatch Strategy Changes Degradation Trajectory
Two identical 10 MW / 20 MWh systems can degrade very differently based on:
- Peak shaving profile
- Solar firming variability
- Frequency regulation aggressiveness
- Partial cycling behaviour
High C-rate, high variability cycling accelerates:
- Lithium plating risk (at low temperatures)
- Resistance growth
- SEI thickening
- Mechanical stress accumulation
Most economic models optimise:
Revenue_today = Power × Arbitrage Spread
They rarely optimise:
Lifetime_value = ∑ (Revenue_t – Degradation_Cost_t)
This is the missing coupling.
Oversizing: Expense or Investment?
Consider two configurations:
Case A - No Oversizing
- 20 MWh installed
- 80% DoD daily
- Replacement Year 6
Case B - 15% Oversizing
- 23 MWh installed
- 60% effective DoD
- Replacement Year 9
Initial CAPEX increase: ~15%Lifetime energy delivered increase: ~30-40%Replacement delay: 3 years
The correct decision depends on:
- Discount rate
- Replacement cost trajectory
- Tariff structure
- Degradation model accuracy
This cannot be solved with static spreadsheet assumptions. It requires physics-linked economic simulation.
Pack-Level Design Variables That Matter
| Design Lever | Impact on Degradation | Economic Impact |
|---|---|---|
| SoC window narrowing | Reduces mechanical stress | Extends usable life |
| Thermal zoning | Prevents hotspot ageing | Avoids module imbalance |
| Parallel string balancing | Reduces uneven stress | Improves residual value |
| Dispatch smoothing | Reduces peak stress | Lowers resistance growth |
| Active thermal control | Stabilizes ageing rate | Improves warranty compliance |
This is where engineering excellence lives and this is where value is created.
The Hidden Mistake in Most BESS Models
Most feasibility studies assume:
Degradation = 2-3% per year (linear)
But real degradation is:
- Nonlinear
- Temperature dependent
- Stress dependent
- Usage dependent
Early-life behaviour looks similar. Mid-life divergence becomes large. End-of-life timing shifts significantly. Small modeling errors compound across 8-12 years.
When the Cell Is Fixed, the Pack Becomes the Product
If you cannot:
- Change chemistry
- Change cathode formulation
- Change electrode design
Then your differentiation comes from:
- Operating envelope engineering
- Thermal management precision
- Dispatch optimisation under ageing constraints
- Degradation-aware techno-economics
In this new paradigm:
The cell is the commodity. The pack is the strategy. And the only way to design that strategy correctly is to couple:
Electrochemical degradation → Operational decisions → Financial outcomes. That is where engineering becomes a capital discipline.
Conclusion: Degradation-Aware Design Drives BESS Value
In a world where cell supply is commoditized, differentiation no longer lives in chemistry. It lives in how intelligently you design, operate, and model the pack. And the core of that intelligence is degradation-aware design.
References
- Journal of Energy Storage — Schmalstieg, J. et al. (2014). A holistic aging model for lithium-ion batteries. Demonstrates nonlinear aging behavior under varying depth-of-discharge and operating profiles.
- Sandia National Laboratories — Protocol for Uniformly Measuring and Expressing the Performance of Energy Storage Systems. Industry-standard framework for realistic BESS cycling and degradation testing.
- Applied Energy — Uddin, K. et al. (2017). Techno-economic analysis of battery energy storage systems considering degradation. Quantifies the economic sensitivity of BESS projects to degradation modeling assumptions.
- Central Electricity Authority — Optimal Generation Capacity Mix for 2030. Official planning document outlining India’s projected storage requirements.
